It is September, and early winter forecasts are trying to predict how much snow and cold will hit us from December through the end of March. Maybe you have read a few of them. They are an interesting read, especially articles that predict specific dates of snow and cold five months out for cities. I admit, I like reading them. They are enjoyable in an entertaining way. For those of us who enjoy snow, they are an outlet. For those of us that run a business based on snow, they serve less of a purpose.
So, allow me to be blunt. This article is not going to predict how much snow Syracuse will see this winter or how cold it will be in Chicago. Three months before winter starts is too early to make specific forecasts. I could make those predictions for you, but they would be guesses. No, in this article, I want to explain how certain circulations are lining up to influence the type of winter we can expect.
Over the last two winters (2015/2016 and 2016/2017), most of the United States experienced warm winters. Most of you know that. However, in context, they were not only warm, but also the warmest or nearly the warmest in 122 years of records.
Figures 1 and 2 isolate the average temperature between December and March. Figure 1 ranks the average temperature of 2015/2016 versus the previous 122 years. Figure 2 does the same for 2016/2017. The maps are broken into regions of the United States. The number 122 in any region equates as the warmest on record. The second warmest is 121. Over the last two winters, only one region had below average temperatures—the Pacific Northwest from December 2016 through March 2017. So, the backdrop going into winter 2017/ 2018 is that most of the United States has experienced a consecutive record of nearly record warm winters. Bummer.
El Niño-Southern Oscillation Phases: Do They Matter?
If you follow the weather, you have probably heard of El Niño. You are a big-time weather fan if you have also heard of La Niña. If you are aware of ENSO neutral conditions, you are probably a meteorologist or want to be one. First, ENSO is short for El Niño-Southern Oscillation. (This article is not an ENSO primer. We can save that topic for next time.) I mention ENSO because it is a large-scale circulation in the Pacific Ocean that impacts North America. ENSO and the specific phase—warm (El Niño), cold (La Niña) and neutral—are very important drivers in the type of winter North America can experience. Simply, El Niño brings mild winters and La Niña can bring average to below average temperatures during winter.
So, how does ENSO look right now as we move into mid-September? Figure 3 shows region 3.4 in the Pacific Ocean is below average by 0.6°Celsius, thus sitting along the cold and neutral phase as region 3.4 is the benchmark for determining the ENSO phase. The ENSO forecast going into winter is displayed in Figure 4. The green bars represent neutral and the blue bars represent La Niña. We are currently neutral and are forecast to shift from neutral to La Niña this fall and winter. This forecast change was announced September 14, and rocked the meteorological community and energy traders. The forecast flip-flopped from a confident neutral phase published in August to a confident La Niña forecast published just a month later. The three-month groupings for winter are highlighted in Figure 4. From November, December and January (NDJ) to February, March and April (FMA), La Niña conditions hold 43 to 61 percent probabilities. Those numbers are slightly higher than neutral and considerably higher than El Niño probabilities. Going into winter, this favors a weak La Niña or a neutral phase.
La Niña and Neutral Historical Record on a U.S. Winter
Since ENSO is a large-scale circulation and it impacts winter conditions in the United States, it is helpful to look at past winters. The National Oceanic and Atmospheric Administration has detailed ENSO records back to 1950. With these records, we can compare the recorded temperature and precipitation for every month since 1950 to the ENSO phase. When compared to long-term averages, we can begin to see the relationship of an ENSO phase with specific regions of the country. So, since a weak La Niña or neutral is highly probable, let’s look at the temperature and precipitation impact nationally.
Figure 5 compares the temperature record from December through March of every winter since 1950 with neutral conditions. Figure 6 compares the precipitation record for the same time of year since 1950. Historical records (Figure 5) show that neutral winters are colder than average for much of the United States with the Great Lakes averaging around a degree below average from December through March. It is slightly cooler than average in the Plains and Northeast. Figure 6 shows most of the country experiences nearly normal precipitation with notably drier conditions along the Pacific Coast.
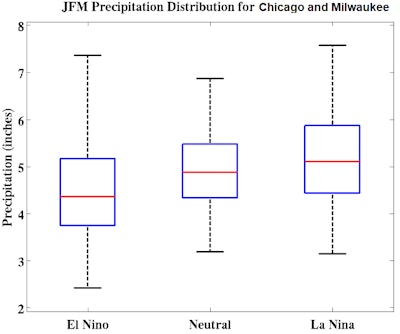
Let’s look deeper into the data. I am selecting specific regions to compare temperature and precipitation during winter. Since we want to know more about snow and cold this winter, I am going to select several cities to analyze the type of winter they can expect. This data is shown in box plots and only comes in three-month blocks. We will look at January through March (JFM). These are typically the three snowiest months of winter. I will select cities from the Midwest, Northeast and West United States.
The cities I have chosen are Chicago; Milwaukee; New York City; Boston; Albany, New York; and Denver and Fort Collins, Colorado. In the Midwest (Figures 7 and 8), Milwaukee and Chicago are cooler and wetter than an El Niño winter. On the East Coast (Figures 9 and 10), New York City, Albany and Boston temperatures and precipitation are about the same as El Niño winters. Out West (Figures 11 and 12), Denver and Fort Collins are cooler and dryer than El Niño winters.
Winter Conclusions
This article relies heavily on the ESNO phase. There are other oscillations in the atmosphere that influence our winter weather as well. However, those oscillations do not allow you to look out five months to predict the weather. They are helpful forecasting in the timeframe of one to six weeks. ENSO will not be the sole driving factor that will impact our winter. However, it has been shown to have a significant impact and can be predicted months out.
After two very mild winters, expect temperatures to return to normal for most of the United States. Precipitation should be more evenly distributed this winter. Unlike last winter. I am looking at you, California. Most of the United States experiences average precipitation. For the northern United States, most locations experience more snow than the winters of 2015 and 2016. This is a broad, long-range outlook. So yes, my analysis favors a return to normal winter, maybe even colder than normal around the Great Lakes. Only time will tell.