The notion that data management is something new is, well, a bit old. Organizations of all industries, sizes and levels of sophistication have been collecting data for decades. What is making data management more of a mainstream topic for business and consumers alike is the proliferation of the amount of data being collected, the disparity of its location and the structure of the data itself. Because of this new generation of complexity, data management is no longer a nice to have, but a must have. If there is no plan in place, it will be more of a challenge to deal with if you kick the can down the road as it grows exponentially daily.
For old school outdoor power equipment (OPE) dealers who still use paper, you are not out of the woods in this conversation, as at some point running a more contemporary system may be necessary if you desire to survive and thrive against the dealer next door. For those OPE dealers who already have a structured method of collecting and processing data, below provides the backdrop of the challenge and some guidance on how to leverage it to make your dealership more productive and efficient.
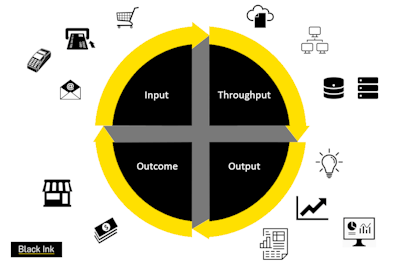
The simplest way to get one’s head wrapped around the journey of data is input – throughput – output – outcome.
- Input – what, how and where the data is being collected.
- Throughput – how and where the information is integrated, stored and accessed across systems, people and processes.
- Output – meaningful and actionable insights to help make smarter and faster decisions.
- Outcome - measuring incremental profit change, which matters most to running your dealership
Data Challenge: data is a closed environment and not-integrated
In broad strokes, there are some basic and common operational workstreams to support the every day tasks at a dealer that more or less uses data to help inform decisions. Inventory management/ordering, financial planning, merchandizing, local marketing, field/in-house sales staff, financing and customer support, to name a few. Depending on the dealership and the brands you represent, there are mandates that are out of your control as regards to these workstreams. For example, if you are a John Deere, you must use their mostly non-integrated proprietary systems to provide estimates, ordering, warranties, etc. If you sell Deere and say another line, the same principle applies. This one example starts to bifurcate your data collection, not to mention the inefficiencies that can be created if and when customers buy two or more different brands at the same dealership. Further, some dealerships need to log into different brand’s parts-look up, product registrations, distributor dealer portals, etc. which even further increases labor costs just to ring up a sale.
Of course, having a DMS system is yet another software tool needed to run the retail location which ties in data around service centers, parts, wholesale pricing at point of sale, general ledger, and customer accounts. Sometimes key data sets within a DMS can connect to an OEM (original equipment manufacturer) like EZ Link, but most of the time it doesn’t. It doesn’t help from an OEM’s perspective that the DMS industry is very splintered across their dealer network making it nearly impossible to integrate or provide bi-lateral data flow between entities, with the likes of HBS Systems, Infinity (c-Systems), Ideal Computer, Epicor, JDIS (eQuip), Basic Software, CDK Global, Charter Software (Aspen), nizeX Inc. (Lizzy). Further, depending on the DMS system, you may be handcuffed to easily access trend data across months or years, by model, customer type, profit centers, etc. This is more apparent with on-premise software versus those hosted in the cloud (private or public).
As sales and marketing continues to become more sophisticated at dealerships so does the need for another set of software tools that also generate a new set of data and integration issues. Commonly used Customer Relationship Management tools (“CRM”) best in class offerings aren’t always best in class. The myth that a vanilla CRM product like a Salesforce can be used “out of the box” by any industry from healthcare to hotdogs companies is just that, a myth – it actually require substantive customization and costs to make it work for you in the OPE space. And not all of these CRM systems will “talk” back to the DMS.
With over 7000+ marketing software tools on the market today (aka Martech), some dealerships unknowingly may be using 3-5 concurrently. This continues to add more and more data sets. Examples may be Google Analytics, HubSpot, Mailchimp, branded OEM dealer locator sites, ecommerce, Facebook, Pinterest, Twitter, media spend on radio, local cable, direct mail response, etc. These are intended to perform inbound and outbound demand generation to darken the door with existing and new customers.
The good news for dealers is that most of the data collected is structured in a database format such as SQL. That said, DMS products are not well known for playing nice to run cross-referenced analytics even within their own eco-system - meaning how the data is collected and stored in the DMS could mean you need additional labor and software to map to files in the DB to get analytics. More bad news: marketing data such as customer behavior is more unstructured, leaving even the most sophisticated dealers with in house IT needing to have additional expertise surrounding master data management, data science and analytics (if integration with DMS is needed). And it is needed.
Is it worth investing in integrating data for even for the smaller dealers? You bet. On average you can gain an additional 7.3% annual revenue by creating efficiencies just for overstock and out of stock inventory management. In fact, retailers lose over $1.1 trillion globally because of mismanagement or lack of visibility. Of that Data Disconnect/Systems ($222.7B) and Supplier Issues ($158.5B) are two top core issues. Source: IHL Group
Data Opportunity: Getting more insight from the data being collected
As outlined, the Input and Throughput tend to just happen without much thought, because all these data points being collected just happen. What gets overlooked is how to integrate the data to provide business Outputs and Outcomes that can help you strategize, plan and execute for a lean retail environment.
There is no sense keeping the status quo hoping progress will happen. That is called inertia. Since many dealers have a scatter chart of software systems across OEMs, dealership and marketing that do not and will never integrate the data, step one is to provide a Master Data Management platform to extract and load to further provide a singular universal truth of the business. This takes expertise and constant DB expertise support. A separate database is needed whereby all the data can get mapped to it in order to add a layer of analytics on top. I’ll site an example use case:
Show me all my high-valued customers for landscaping company greater than 5 trucks located within a 15-minute drive time of my store who have bought product A but not product B in past five years but do not always get seasonal service. They will more likely buy product B by the time my open house starts in 2 weeks. (aka cross-selling to a target market)”
“Show me an increase of parts requests for all models growing over baseline demonstrating a signal for increasing service support and a harbinger for a potential product recall. Then give me a list of those customers with a propensity to ask over the next 10 business days that may have/have not filed for warranty.”
“Show me all my homeowner males between 35-45 with large acreage properties that buy across both my stores, by model, compared to the radio investment in my local DMA.”
“Show me my BOPUS (Buy Online Pickup in Store) customers who also made different SKU purchases in separate transactions. Then I want lookalike customers who have made similar or dissimilar transactions.”
These may seem like commonsense questions to ask, but from a data management perspective it’s a heavy lift to give you the answer you seek. It requires customer files matching for names and addresses. It needs cross brand purchases for whole goods, parts and service married up with any relevant warranty data. That in combination with geo-spatial lat. long., propensity modeling, price optimization, inventory on hand and marketing stimuli deployment and response tracking. In short, a Master Data Management (MDM), Customer Relationship Management (CRM), Geo-coding, Geo-mapping (GIS), Business Intelligence (BI), and Marketing Automation (MA) hand built algorithms from data scientists, all working together in real-time with one click feeding into easy to understand outputs with a tech response time of less than 3 seconds across all your systems. One missing data set could throw off your outcome and provide a false positive or an incomplete answer.
“The single most critical and basic metric for any retailer is to know, by square foot, what is the revenue, gross margin, and net income.” Source: Larry Nagle, Vice Chairman of Floor Covering Industry Foundation and former CEO of Color Tile and Burlington Industries.
“In addition to profit per square foot, we use inventory turnover, as a critical financial metric to judge the health of our retailer.” Confidential Source: President of Home Goods, a TJX Company.
All retail companies should have the most basic key performance indicators to run their operations with precision. Is OPE so unique that is should divorce itself from all other types of retailers out of its category? Not at all. However, many dealer management leaders are so heads down trying to keep the shop humming that they can’t see the forest through the trees. Big Box companies live and breathe by key health metrics and so should you. Typically, these are the top retail KPIs reviewed daily or weekly to understand the health of the retailer and dealer business:
- Gross margin on inventory (GMROI),
- Profit per square foot (linear and/or floorplan),
- Product turnover rates (by model)
- Same store sales
- Sale count
- Average Transaction Value/Basket Value
- Product return rate
- Sell through percentage
- Gross margin by profit centers (e.g. whole goods, service, parts)
Let every OPE dealer remind themselves that they are competing against big box analytics that is world class, and in real-time. (Why do you think they moved the Christmas selling season to early October, and why Valentine’s shows up in December?). What they don’t have that you do is knowledge of the end user customer. This is your competitive advantage with 100% coverage. Marry that up with best in class retail data-driven analytics, and you can continue to get, keep and grow your customers ergo your business growth. If you nail this down, then you can take on your next challenge regarding ecommerce omnichannel execution. That, my friends, is for another day.


![Gravely Pro Turn Mach One My23 Dsc03139 Edit 1200x800 5b2df79[1]](https://img.greenindustrypros.com/mindful/acbm/workspaces/default/uploads/2025/10/gravely-pro-turn-mach-one-my23-dsc03139-edit-1200x800-5b2df791.BucBnDoN22.jpg?ar=16%3A9&auto=format%2Ccompress&dpr=2&fit=crop&h=135&q=70&w=240)


